BI 231 Physiology Lab exercises
HEART RATE MEASUREMENT
To gather heart rate data using the MacLab computer data acquisition package:
1. Start the computer. Here's the basic system:
The computers are controlled by two power switches.
First, turn on the power strip everything's plugged into; this strip is on the shelf beside the monitor.
Then turn on the computer by pressing the power key on the front of it.
The computer should come on, and so should the MacLab/2e. A green light will light up on the front of the MacLab/2e and a red light will appear on the front of the Eth 250 amplifier.
We've already set up a file with the right settings to record pulse or heart rate. It’s in the file named ‘BI 231-Net’ on the desktop of the computer, under the heading ‘MacLab’. The file you want is called ‘Finger Pulse Setup.’ Doubleclick on it and it will start the MacLab program.
The MacLab screen
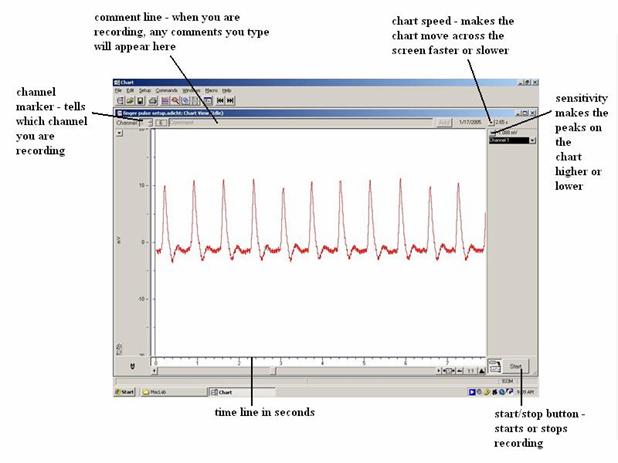
1. Check the channel marker. Make sure the channel label says channel 1', and that the pulse transducer is attached to the top plug of channel 1 on the MacLab box.
2. Now, attach the pulse transducer to the subject. The pulse transducer should be wrapped around the subject's finger pad tightly enough to detect changes in the pressure as blood moves in and out of her finger, but loosely enough to let blood flow.
3. Now, set up to record. You can have everything hooked up, but your settings might be all wrong - like having your stereo all hooked up correctly, but the volume and balance set wrong. The only way to find out is to actually try to record some data, and see if it works.
Click the ‘Start’ button on the lower right of the screen, and you should see your data appear on the computer screen!
Adjust the sensitivity until your peaks fill about 1/3 of the screen.
Change the chart speed until you are getting about 20 peaks on a screen.
Type the name of the person you are testing - it will appear in the Comments bar
Now hit ‘return’ and a dotted line will appear down the screen. This line has attached your comment to the trace, so you can find this spot again.
5. Define your experiment
Write down your hypothesis about something that should affect heart rate and how and why you think it will affect it.
Write down how you will test your
hypothesis using the finger pulse measurement equipment. Include what you will
type in the comments bar to keep track of what you have measured.
Plan your data table – you will be entering these data into Excel and graphing them. What will you record? How will you graph it?
Now do your experiment. Be sure to enter comments for everything you do. Remember, the comment is not entered when you type it but only when you hit ‘return’ – so type it ahead of time and hit ‘return’ just when the person starts doing what you told them to do.
When you are done, save the file to your student folder as ‘Lab 1- heart rate data.’
Analysing your data
Just having data isn't enough for an experiment. You made predictions about how pulse rate would change, so you need to analyse the data trace and figure out what the pulse rate was. Here's how to do it:
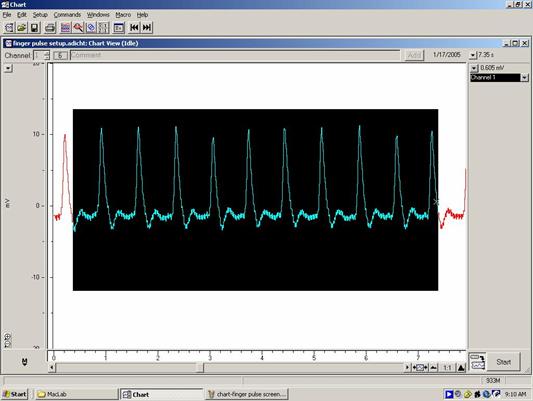
When you stop recording, a time scale appears at the bottom of the screen. Count heart beats for at least two 10-second sections of your data, calculate beats per minute, and average the two rates.
One easy way to do this is to put the cursor at the beginning of the trace, hold the mouse button down, and drag the cursor to the right to select a 10-second segment of your trace; just count the peaks in it.
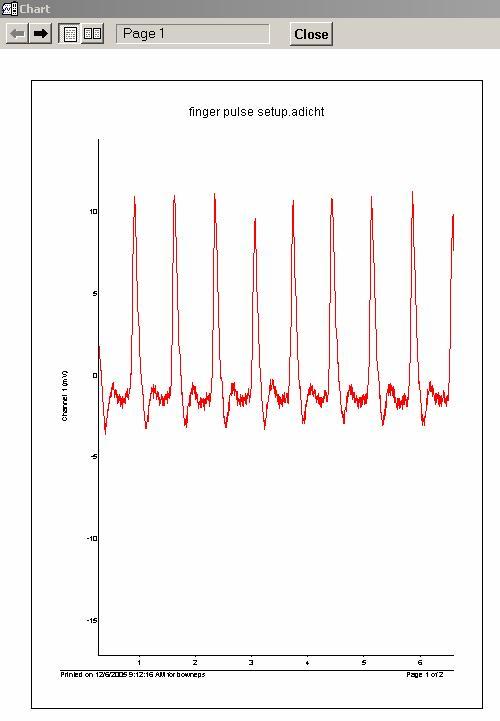
Choose ‘Print Preview’ from the File menu and you will see the section of the trace that you selected. Close this window and you can use ‘Print Selection’ to print it out.
WARNING!!! Never print the whole file! It will be hundreds of pages long, and use up all your printing pages for the semester.
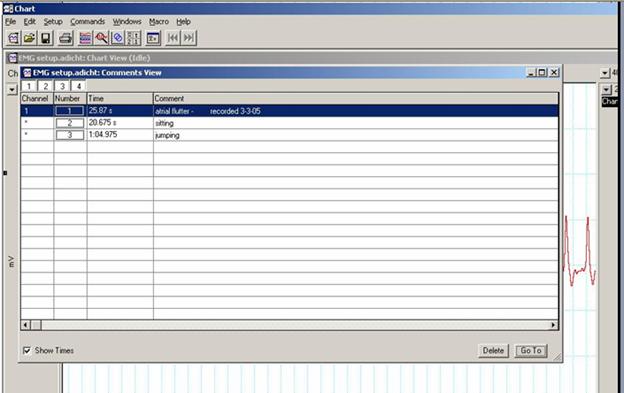
To compare two parts of your data: First, take measurements from the first part of the data. Then, go to the Window menu and choose Comments. You'll see all the comments you typed in. If you just click on the one you want and then on Go To, the stored data trace will move to that point. Then you can take data from that section of the trace.
TURN IN:
1. A printout of a selection from your MacLab data, showing a comment marker and a section of the trace long enough to calculate heart rate from. Annotate this trace to show how you calculated heart rate from it.
2. Your data in an Excel spreadsheet
3. A statement interpreting your data:
Did your data support your hypothesis or refute it? NOTE – YOU CANNOT PROVE A HYPOTHESIS; NEVER USE THE ‘P’ WORD IN SCIENCE!
4. Discussion of your experiment:
What might have influenced your data? What would you do differently if you repeated this experiment?
A satisfactory lab report may then be given to your class instructor as partial demonstration of the quant skill 'calculating heart rate.'